

Daily, weekly and monthly view for the campaign revenue graph
Switch the campaign revenue graph between daily, weekly and monthly to see up to 12 months of revenue.
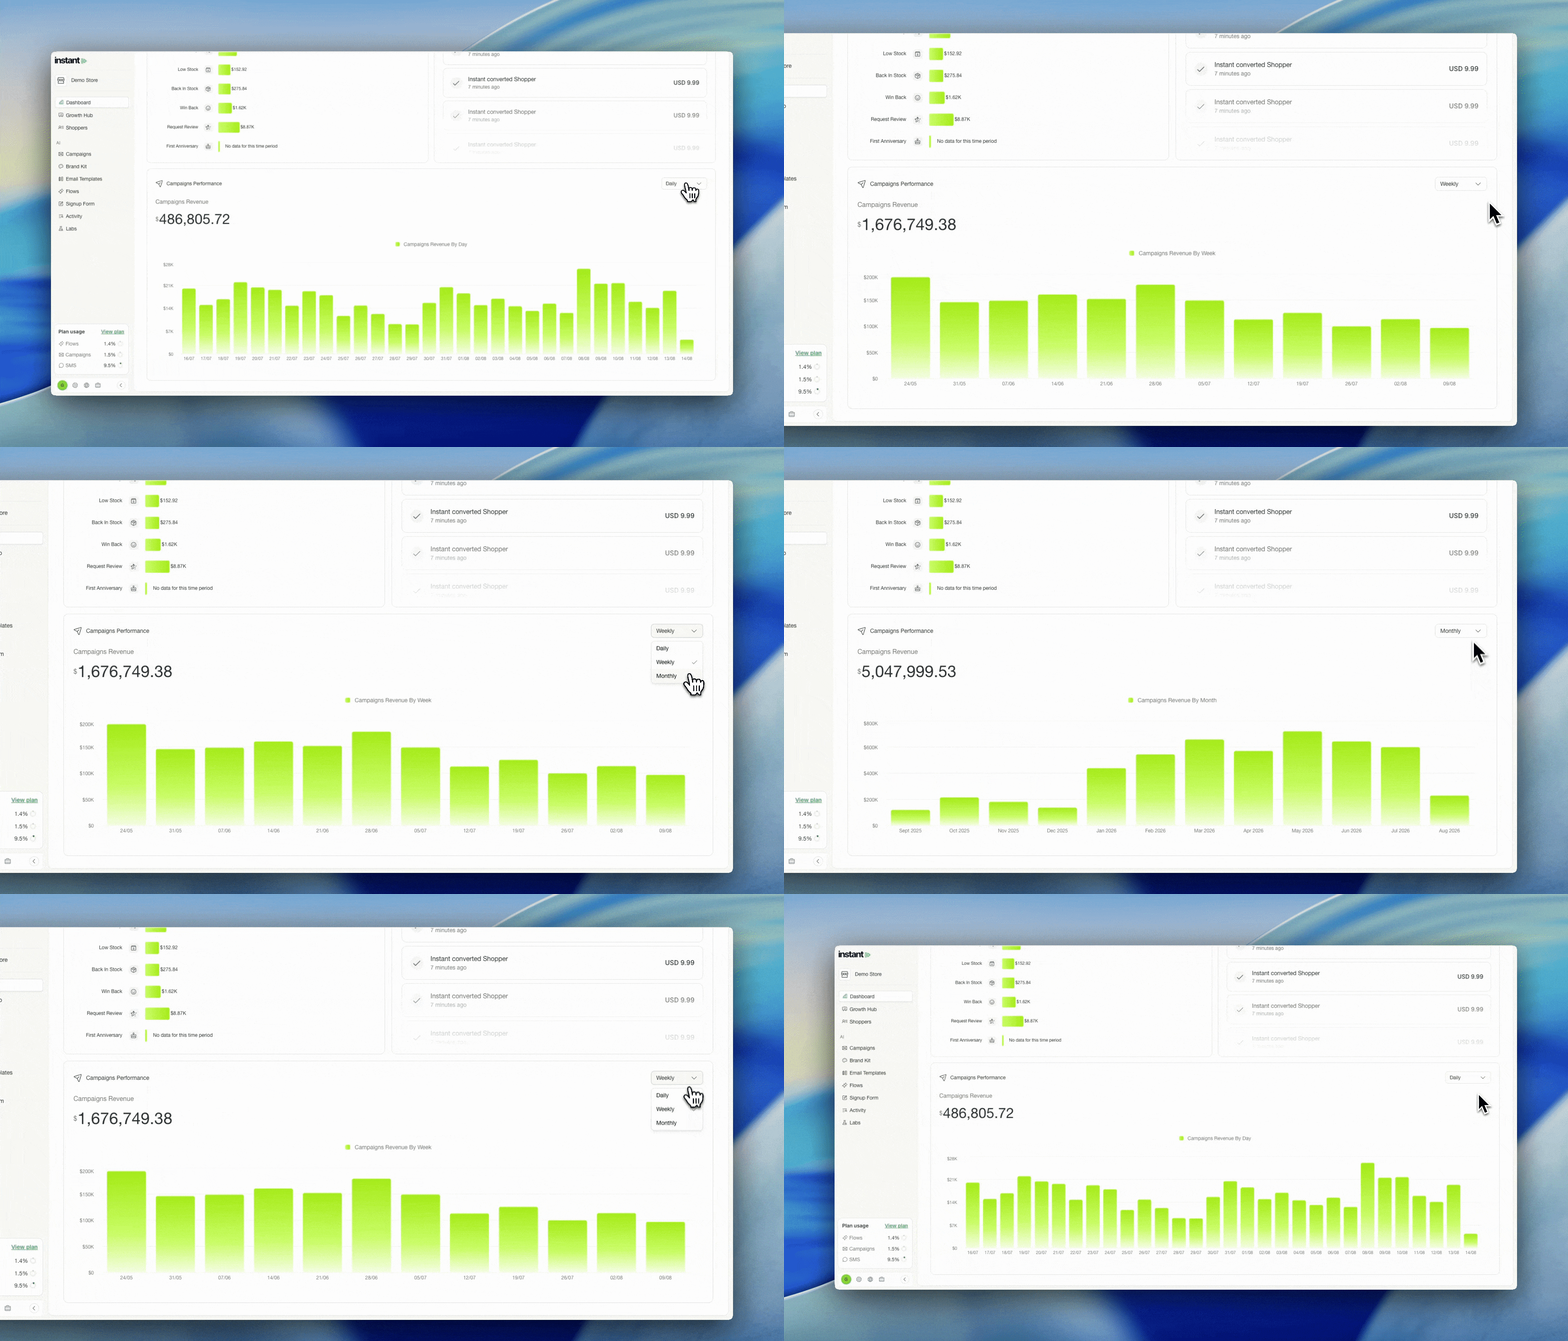
- The campaign revenue graph can now be filtered by daily, weekly or monthly, instead of showing the last 7 days only
- Switch to monthly to see your total campaign revenue across the past 12 months
- Switch to weekly or daily to compare this week against last week
- Find it on the campaign revenue graph at the bottom of your
Dashboard